As a product manager, key performance indicators (KPIs) are the most important tools influencing your decision-making processes. Product management KPIs measure the progress of your team and your product, and you can see just how much your product resonates with existing customers.

Without KPIs, you won’t be able to make data-driven decisions or prove the success of your product with hard data that your CEO and potential investors can believe.![→ Download Now: Free Product Marketing Kit [Free Templates]](https://no-cache.hubspot.com/cta/default/53/08b5e1f4-5d26-405b-b986-29c99bd0cb14.png)
There are tons of product management KPIs you can track, making it difficult to know which ones to pay attention to. To help, I spoke to product managers and CEOs to learn about the top KPIs you should pay attention to this year.
In this post, we’ll dive deep into what product management KPIs are, what they measure, and how to track them.
Table of Contents
What are product management KPIs?
Product management KPIs are data that reflect your product’s performance in the market. These KPIs use quantitative metrics to determine if you’re accomplishing your goals related to customer acquisition, engagement, product usage, user experience, and revenue.
Since KPIs give you insights into what’s going on in your product and how customers perceive your business, you can use them to make informed decisions, solve problems, and deliver valuable products to your target audience.
Alexey Klochay, the founder of Wizard on Demand, understands the importance of measuring KPIs. “Measuring KPIs create focus, as reporting on a number repeatedly makes that number top of mind for the PM, and they start looking for ways to increase or reduce the number,” Klochay explains.
“KPIs are also a good indicator of business health: the Director of Product Management or the CPO can understand the initiatives at a glance by looking at the team’s KPIs. Other teams in the organization, such as sales and marketing, can benefit from knowing about PM KPIs as well, both directionally (to know how the product is going to evolve and communicate that to their customers), and specifically (maybe the salesperson knows a perfect prospect to be a beta tester for a new feature).”
14 Product Management KPIs
We talked to more than 20 founders, CEOs, and product managers, and here are the product management KPIs they advise marketers and managers to monitor in 2023.
1. Customer Retention Rate
Customer retention rate (CRR) is the percentage of customers (or users) that continue to use your product after a certain period. This KPI gives you insight into how useful and relevant your product is to your target audience.
If your product has a high retention rate, it confirms a real need for your product in the market. On the flip side, a low retention rate indicates that your product isn’t meeting your audience’s needs or it’s not engaging enough for people to stick with it.
Sam Seely, CEO of Knock, believes that CRR is the best metric to measure for SaaS products.
“None of the other work you‘re doing matters if you have a product that users don’t stick with,” says Seely. “The standard KPI I use for this is day 90 retention (aka D90 retention), which shows what percentage of users are still using your product 90 days after they sign up. In enterprise SaaS you want this to be above 70%. If you're above 90%, even better.”
How to Calculate Customer Retention Rate
Let’s adopt Sam Seely’s method and use D90 retention to calculate CRR. Say you had 250 users in January. Between January and March, you lost 10 customers and acquired 30 new customers, bringing your total number of users to 270.
Your CRR would be: [(270 - 30) ÷ 250] X 100 = 96%
Pro tip: If your CRR drops, try to identify where the problem is coming from. Talk to your sales and customer support team to find out the significant problems that customers have regarding the product. Also, be on the lookout for a new competitor.
2. Customer Churn Rate
While customer retention rate measures the percentage of customers who stayed, customer churn rate (CCR) measures the percentage of users who stopped using your product (i.e. canceled paid subscriptions).
Just like CRR, customer churn rate can tell you a lot about your product’s level of customer satisfaction. Faizan Fahim, a product manager at InfraCloud, explains why customer churn rate is important.
“[Customer churn rate] indicates that users who have used the product are leaving -- which means they need the product but not ours, specifically,” Fahim explains. “The marketing, sales, and engineering team may not be working great — and so, the product is not able to deliver the value it should. This is probably because the product lacks some important features or has a hard-to-navigate interface.”
Pro tip: If customers are canceling their subscriptions a lot, check with your sales and customer support team to find out why. Also, check reviews on third-party platforms to see if you can find some reasons as to why. When you do, you can fix the problem(s).
How to Calculate Customer Churn Rate
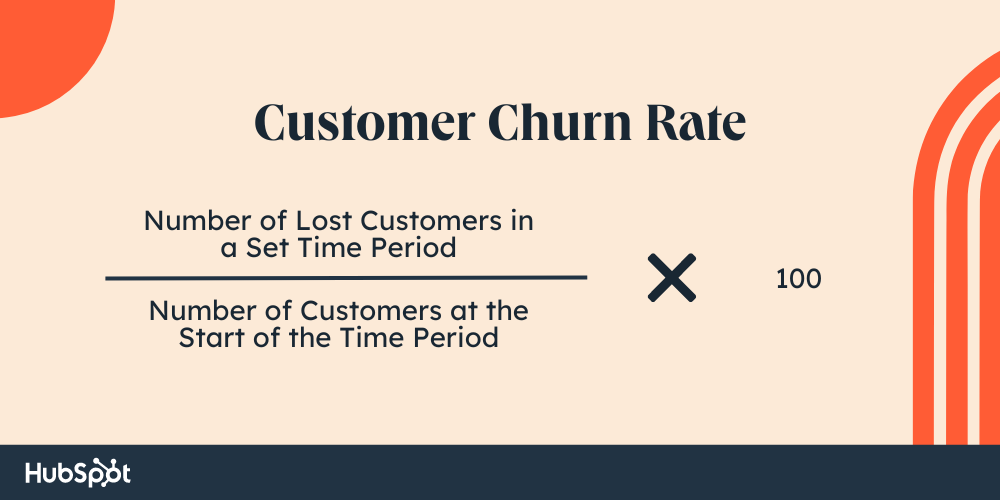
Say, your business had 300 customers on March 1st and lost 15 customers by March 31st, your CCR would be (15 ÷ 300) x 100 = 5%
3. Trial Conversion Rate
As a product manager, you don’t want people to sign up for your free trial and then disappear once the trial has expired. That’s why you should measure your trial conversion rate (TCR).
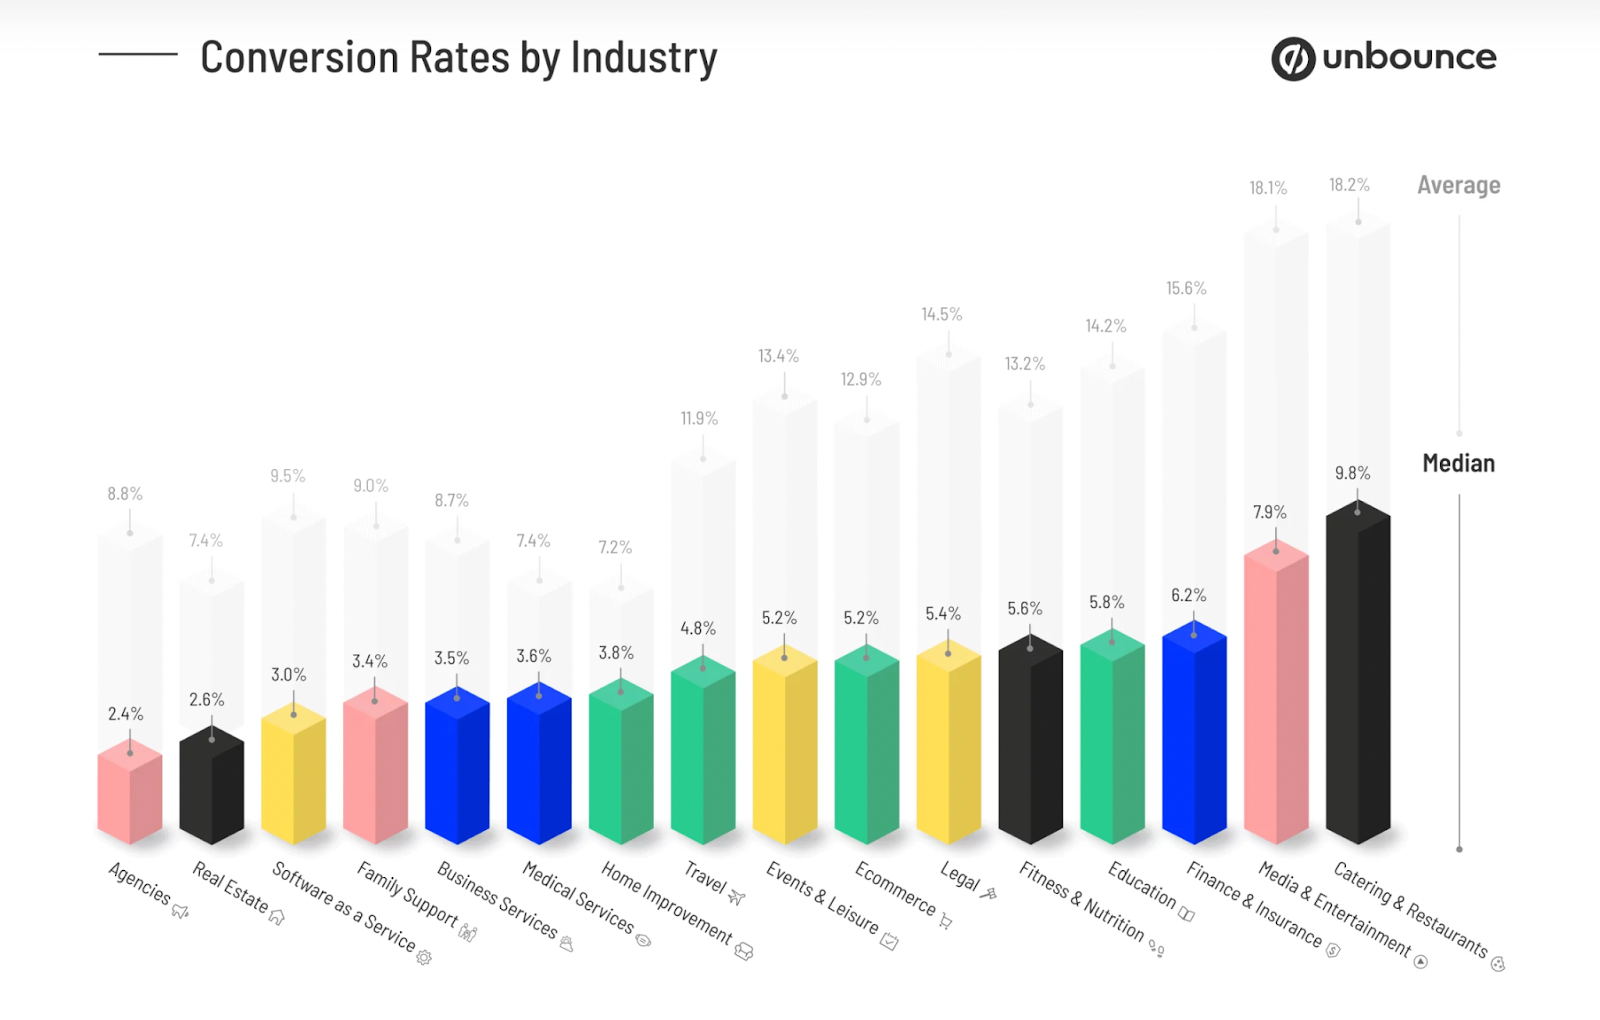
This KPI tells you what percent of your customers sign up for your paid plans after their trial is over. It also gives you insight into how successful you are at convincing prospective customers to subscribe to your product after they’ve tried it. The higher your trial conversion rate is, the better your customer acquisition — and vice versa.
Conversion rates in SaaS companies vary based on industry, type of product/service, and the model of your product (e.g., B2B or B2C).
How to Calculate Trial Conversion Rate
![TCR = [Number of trial-to-paid customers ÷ total number of free trial users] X 100](https://blog.hubspot.com/hubfs/Google Drive Integration/product management kpis_52023-1.png)
So, if you have 50 free trial users within a given period and 34 converted to paid plans, your TCR will be [34 ÷ 50] X 100 = 68%.
Pro tip: You can measure the effectiveness of your marketing campaigns by tracking the TCR of each customer acquisition channel and audience segment. This way, you can optimize your campaigns to yield better results.
4. Customer Lifetime Value
Customer lifetime value (CLV) measures how much money a customer will generate for your business as long as they use your products and/or services.
It’s no secret that it’s easier and cheaper to keep existing customers than it is to acquire new ones. So, increasing the value your existing customers bring is an excellent way to scale your business.
By calculating CLV, product managers can determine which types of customers are most valuable to their business, channeling their customer acquisition and retention efforts accordingly.
This KPI also helps you gauge customer loyalty. If your existing customers keep paying monthly or yearly to get access to your product/service, then you must be doing something right.
A great example of a company that understands the importance of CLV is Spotify. Instead of playing random songs, Spotify’s algorithms are designed to determine the songs that you’re most likely to enjoy based on previous searches/plays. These curated playlists increase your chances of renewing your subscription and staying on the platform.
Will Yang, the Head of Growth at Instrumentl, phrased the importance of CLV well.
“[CLV] is a great way to understand what type of customer you want to attract, how they use your products, and how they react to different marketing campaigns,” Yang says. “This KPI has helped me make better decisions about what features to build into our product now, which ones we should put on hold or remove altogether, and how we should position ourselves in the market.”
How to Calculate Customer Lifetime Value
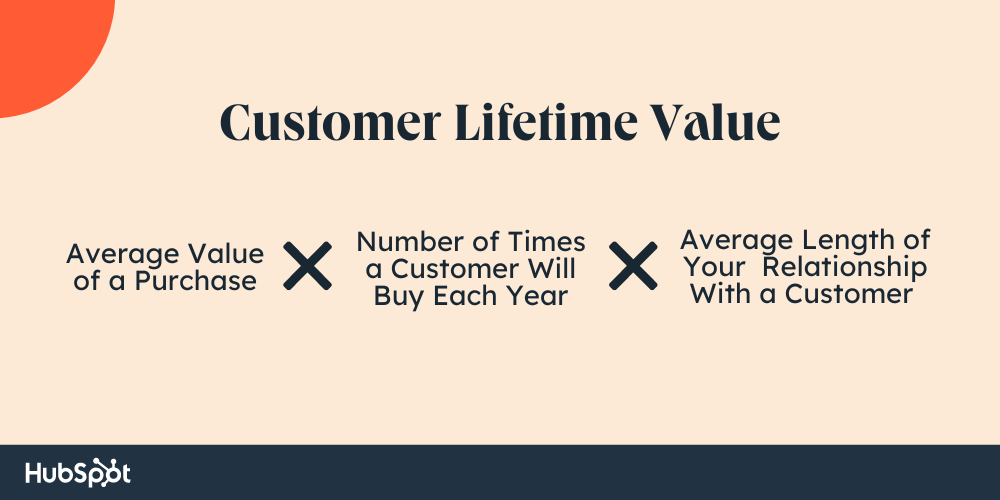
Say you sell sportswear and accessories for athletes of all ages. A professional adult football player who regularly buys cleats from you might have a CLV of:
$80 (for a pair of cleats) x 3 (pairs each year) x 10 (years of being a customer) = $2,400
Pro tip: You’ll have to determine your average purchase value, customer value, and average customer lifespan before you’ll be able to calculate your customer lifetime value.
5. Customer Acquisition Cost
Customer acquisition cost (CAC) measures the expenses — time, money, effort, and resources — spent to generate qualified leads and convert them into paying customers. CAC includes:
- Cost of marketing materials.
- Cost of running ads.
- Cost of marketing software.
- Sponsorship fees.
- Salaries of sales and marketing teams.
CAC helps you understand if your time, money, and effort are being spent as judiciously as possible. Once you understand how much it costs to acquire customers, you can start making changes to reduce these costs without lowering the number of customers you acquire.
This increases your return on investment (ROI) and allows you to allocate the saved resources to other ventures/strategies that move the needle toward business growth.
The CEO of AdmixGlobal, Dmytro Sokhack, knows all about this.
“One of the SaaS products I managed had a high CAC, but a low churn rate. This meant that while it was expensive to acquire new users, once they started using the product, they tended to stick around for a long time,” Sokhack says. “By reducing CAC, we were able to significantly increase profitability while maintaining a high level of customer satisfaction.”
How to Calculate Customer Acquisition Cost
There are many formulas to calculate CAC, but the simplest one is as follows.
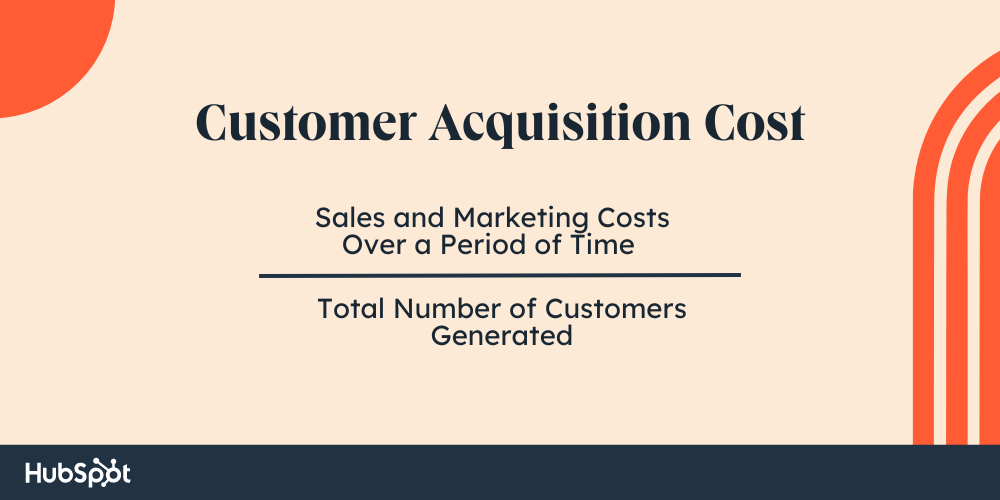
Let’s say you’re a marketing manager at a SaaS company and earn $60,000 as annual income. You spent $25,000 to run four marketing campaigns the year before (Q1 - Q4). These campaigns helped you acquire 6,200 new customers.
Your CAC would be [($60,000 + $25,000) ÷ 6,200 = $13.70
This means you spent $13.70 to acquire each customer.
Pro tip: Analyze CAC with CLV to determine whether your customers are generating less profit than the amount of money you spend to acquire them. If that’s the case, you should tweak your pricing and product marketing strategies to tip the scales in your favor.
6. Monthly Recurring Revenue
Monthly recurring revenue (MRR) measures how much money your business makes every month.
This KPI works great for subscription-based SaaS products as it tracks your performance across the different pricing tiers to determine average monthly revenue. It also helps predict how much money you’ll make in the following months.
When you know what your revenue will look like in the next couple of months, it’ll be easier to allocate resources to departments and marketing strategies.
Note: Businesses whose customers pay monthly or yearly can determine/foretell MRR more easily than businesses that rely on one-time transactions.
How to Calculate Monthly Recurring Revenue
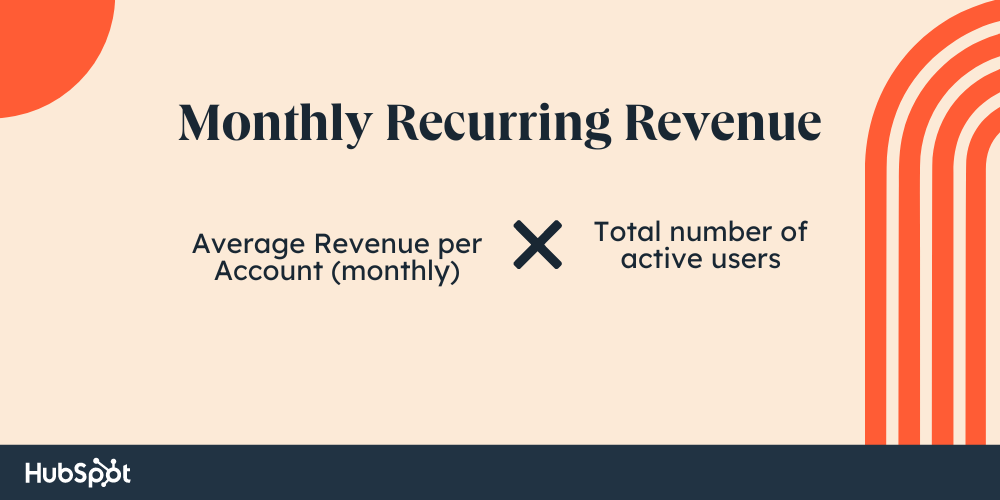
So, if 60 customers are paying you an average of $50 per month, your MRR would be $50 x 25 = $1,250.
Pro tip: Multiply your MRR by 12 to get your annual recurring revenue (ARR).
7. Average Revenue Per User
Average revenue per user (ARPU) is the amount of money your business can expect to receive from an individual customer. This KPI goes deeper than MRR because it examines each customer's spending — as opposed to all customers within a given time period.
With ARPU, you can identify trends in customer segments. For example, suppose your product serves both small businesses and enterprises (on different pricing tiers). In that case, the average revenue per enterprise will likely be much higher than the average revenue per small business.
If your ARPU for one customer segment is low, there’s a good chance you’re not getting enough value from those customers. Tweak your price points, add a new subscription plan, or change your sales strategies to increase your ARPU.
Knowing the patterns and trends that exist within your customer cohorts can influence your upsell/cross-sell opportunities, increase your customer lifetime value, and sustain your business model.
How to Calculate Average Revenue Per User
If your MRR is $20,000 and you have 240 customers, your ARPU is $20,000 ÷ 235 = $85.
8. Daily Active Users
As the name implies, daily active users (DAU) measure the total number of unique users who use your product every day. Many product marketers regard DAU as a vanity metric, but that’s not exactly the case.
Your DAU is the first step in a product health check, and it shows you how your customers are engaging with your product/service. If your product is one that should be used every day, your DAU can clue you in as to whether people are using your product the way you want them to.
A high DAU shows that your product is providing value to your users. However, a low DAU shows that users aren’t finding what they are looking for in your product.
Your DAU can also reveal significant insights, such as the features users are engaging with, features they don’t use at all, and their drop-off points. This helps you identify which areas of your product you should focus on and which parts aren’t necessary.
DAU can also show which parts of your products matter most to different demographics. This can help marketers craft targeted campaigns to reach those customers. You may even discover features that users may deem over-complicated. Fixing these issues can improve customer experience and reduce churn rate
How to Measure Daily Active Users
There’s no formula to measure DAU. Instead, marketers use KPI reporting and analytics software (more on that below) to capture this data.
Pro tip: Each company has a different opinion of what an active user is, depending on the kind of product it has. For example, someone who logs in to a product isn’t the same as someone who uses the product to complete a task it was designed for.
A streaming service like Netflix may regard someone who has watched 3+ movies in the last week as an active user. But YouTube might view an active user as someone who’s watched 3+ hours worth of videos.
Note: You can also track your weekly active users (WAU) and monthly active users (MAU).
9. Bounce Rate
Bounce rate is the percentage of people who visit a page on your product and leave without taking any action, such as requesting a demo or signing up for a free trial. Your bounce rate gives you an insight into how compelling your landing page copy is and how well your product attracts visitors.
A high bounce rate indicates that your product and the landing page aren’t doing a great job of attracting leads. A low bounce rate, on the other hand, shows that visitors like what they see when they come across your product page and are willing to learn more about how your product can serve them.
Knowing your bounce rate gives you a chance to optimize your product and web copy to capture and keep visitors on your website.
How to Calculate Bounce Rate
![Bounce Rate = [Number of visits without further action ÷ Total number of visits] x 100](https://blog.hubspot.com/hubfs/Google Drive Integration/product management kpis_52023-4.png)
So, if you had 5,000 visits to your product homepage in a month and 1,500 were single-page visits, your bounce rate would be (1,500 ÷ 5,000) x 100 = 30%.
Note: If your bounce rate exceeds 60%, you should try to identify and fix the problem.
10. Time-to-Market
Time-to-market (TTM) refers to how long it takes to bring a product or product feature from conception to availability for sale in the market. This process encompasses the ideation, design cycle, production, market release, early purchases, and analyses of successes and failures.
TTM can either be used to evaluate brand new products/product features or the improvement of existing product features. Taras Velychko, a product manager at Relokia believes that time-to-market is a great KPI to track because “it reflects a product team's ability to launch a product on time and within budget successfully”.
The quicker the product is released to the market, the less competition the company will face. It’ll also get a bigger market share and enjoy better profit margins.
How to Measure Time-to-market
There’s no specific formula to calculate TTM because the entire process depends on the specific business, product, and team. These factors play a huge role in the ideation, production, and launch process.
11. Net Promoter Score
Net Promoter Score (NPS) is a KPI that measures the number of customers who are likely to recommend your product to others and those who aren’t.
If you use SaaS tools at work or in your personal life, you must’ve come across this question: How likely are you to recommend our product to your friends/co-workers? You are required to choose how likely you are to recommend the product on a scale of 0 to 10. That question measures NPS.
People who choose 0 to 6 points are detractors. They’re not very likely to recommend your product to others. Users who choose 7 to 8 points are neutrals — they’re not too sure if they will recommend it or not. And those who chose 9 to 10 are promoters. They’re very likely to recommend your product to others.
If your NPS is high, it’ll motivate employees and teams to ship faster and do more quality work. If it’s low, you’ll be able to figure out what the problem is and fix it.
How to Calculate NPS
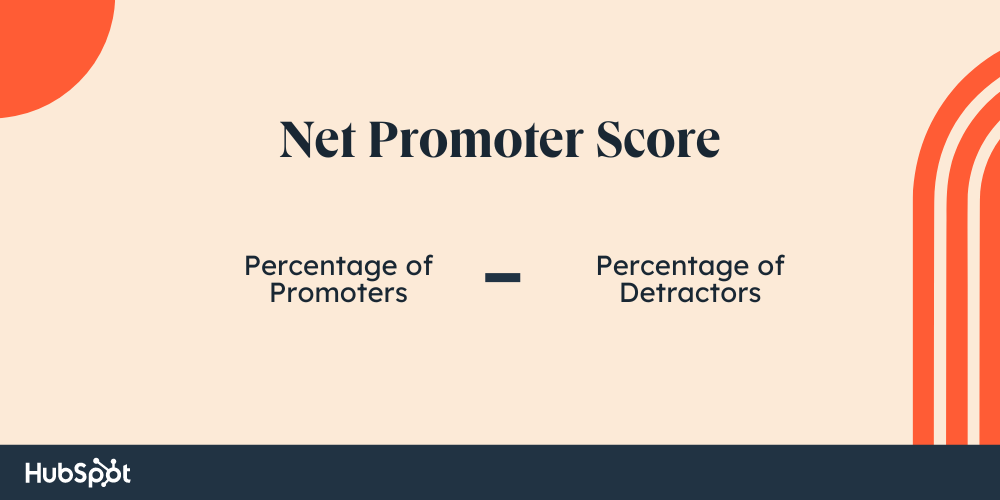
Note: In your NPS survey, ask users why they chose the number that they did. If they are detractors, they’ll likely tell you why they won’t recommend your product to others.
If they’re promoters, they’ll tell you why they will. Any information you get from detractors should be shared across all departments to improve your product and your customers’ experience.
12. Customer Satisfaction Score
Customer Satisfaction Score (CSAT) is the extent to which customers like a particular product or service feature. It’s similar to NPS in that users are asked to rank a product or service feature on a scale of 1-5 or 1-10, with the highest number signifying “very satisfied” and the lowest signifying “very unsatisfied.”
The answers you get on your CSAT survey will help you know whether customers are happy with your product or not. If they’re unhappy, then you know to focus efforts on improving customer experience.
How to Calculate Customer Satisfaction Score
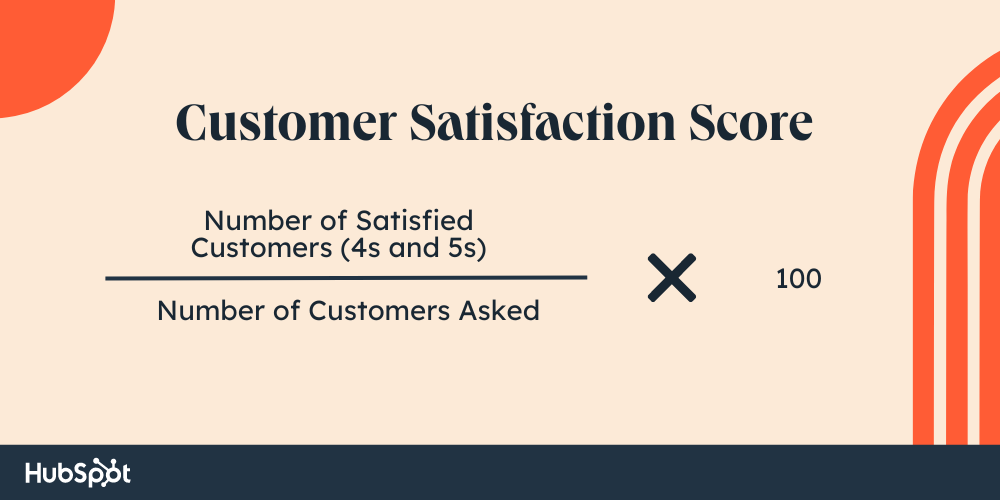
Say you sent out a CSAT survey to your 500 existing customers. Of them, 350 of them completed it, with 130 of them picking 4 (satisfied) and 160 choosing 5 (very satisfied). Your CSAT would be [(130 + 140) ÷ 350] x100 = 77.14%.
13. Number of Sessions Per User
Number of sessions per user is a KPI that measures the average number of times your users return to use your website or app. This KPI shows how popular your product is. If your users keep coming back to your product, it’s safe to conclude that they’re interested in what your product can do for them. If not, then they’re likely on the verge of churning.
How to Calculate the Number of Sessions per User
Just like DAU, the number of sessions per user is usually tracked with a KPI reporting tool. In this case, you’ll have to track user logins.
If your analytics tool tracks users and sessions, you can get the sessions per user by dividing the sessions by the number of users.
For example, say your website/app was visited by 15,000 users in a month. Your analytics tool records your sessions as 35,000. Your number of sessions per user would be 35,000 ÷ 15,000 = 2.3.
14. Number of User Actions Per Session
Number of user actions per session tracks the actions a user took and/or the features they used while they were using your product. This KPI is great for showing how popular certain features have been since they were introduced. This is especially useful if you just launched a new feature or are checking to see what people use your app for the most.
Once you know which features people are using — and which ones they aren’t — you can make product iterations that continue to meet customer needs.
How to Calculate User Actions per Session
This KPI can only be determined through your KPI reporting software.
Pro tip: Use your number of user actions per session in A/B testing to understand customer behavior and make decisions about features, UI/UX elements, and other product areas.
Process-Driven KPIs
The end goal of measuring KPIs is to gauge product adoption. Product adoption is the process by which prospects learn about your product and start using it to achieve their goals — personal, career, or otherwise.
However, some well-known KPIs like the ones listed above may not be specific enough for product marketers/managers to work with. They may be too surface-level, and that’s why product managers use process-driven KPIs that are more granular and closely related to the product or problem they’re working on at the moment.
Thibault Grall, the Senior Product Manager at Castor explains, “From my experience, KPIs alone are rarely enough to measure success as a PM. They need to be linked to an objective so you can actually monitor a trend change in adoption or performance.”
When Alexey Klochay of Wizard on Demand was working as a product manager, he chose KPIs that were “focused around the specific part of the product I was covering, plus some core competencies that I wanted to develop. These KPIs were often numeric (i.e., going from 0 or 1 of something to 10 or 20 of something).”
Here are some process-driven KPIs Alexey worked on:
- Growing the number of customers using feature X from 0 to 10.
- Top-line revenue for a product line.
- Discovering two viable solutions for Y problem.
- Delivering a specific version of a feature.
Abhishek Anand, who leads product and marketing at FirstDraft, measures product-related KPIs. For context, FirstDraft is a generative AI tool that helps people create long-form articles using just the title of the article. Here are some of the KPIs Anand measures:
- The number of demo requests.
- % of users that sign up post demo.
- % of users who generate at least one draft on the same day they register.
- The number of requests made by the user in Week 1.
- The average number of article titles in each generation request.
- The number of days before the user makes their first transaction, and which transaction bucket is most opted for.
- The number of visitors to our website from the demo PDF.
According to Anand, these metrics are more important than MRR because “they help us get better visibility into our customers’ aspirations.”
How to Measure Your Product Management KPIs
Now that you know which product management KPIs to track, all that’s left is to actually track and measure them. The best way to do that is through KPI software. Here are three great ones you should try.
1. Google Analytics
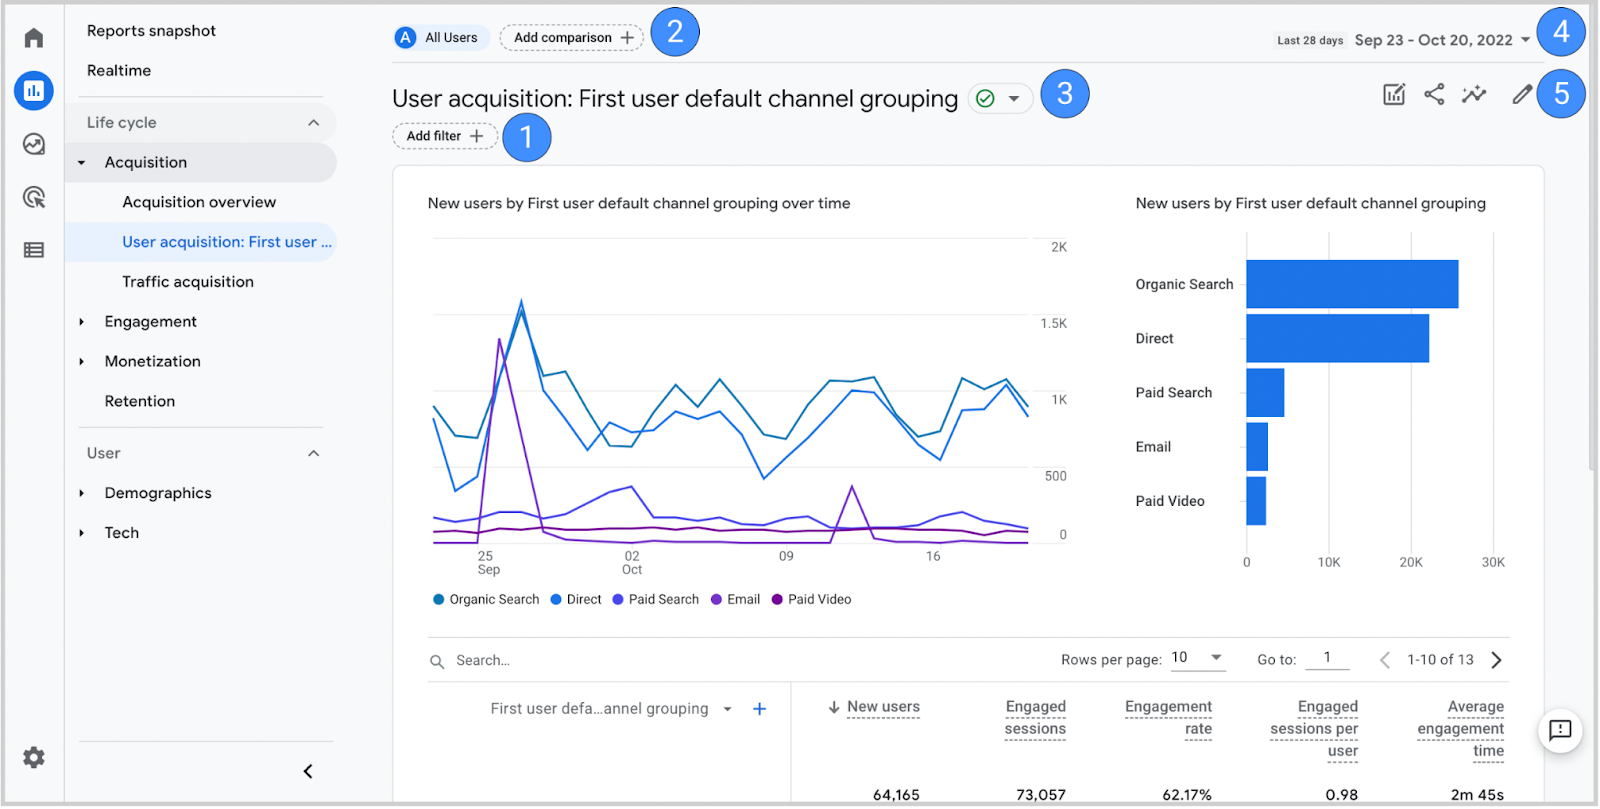
If you work in marketing or any related field, then you must have heard of Google Analytics. This wildly popular software measures website visitors and the actions they take during the time they spend on the site.
Google Analytics tracks visitors from several sources, including search engines and social media networks, direct visits, email, and other referring sites. It also tracks pageviews, sessions, session durations, bounce rates, conversions, and many more.
This data can help you determine your top sources of traffic, get your visitor demographics, gauge how successful your marketing campaigns are, track goal completions, and discover patterns/trends in user engagement. This way, you’ll know how visitors use your website and figure out ways to keep them coming back.
2. Google Looker Studio
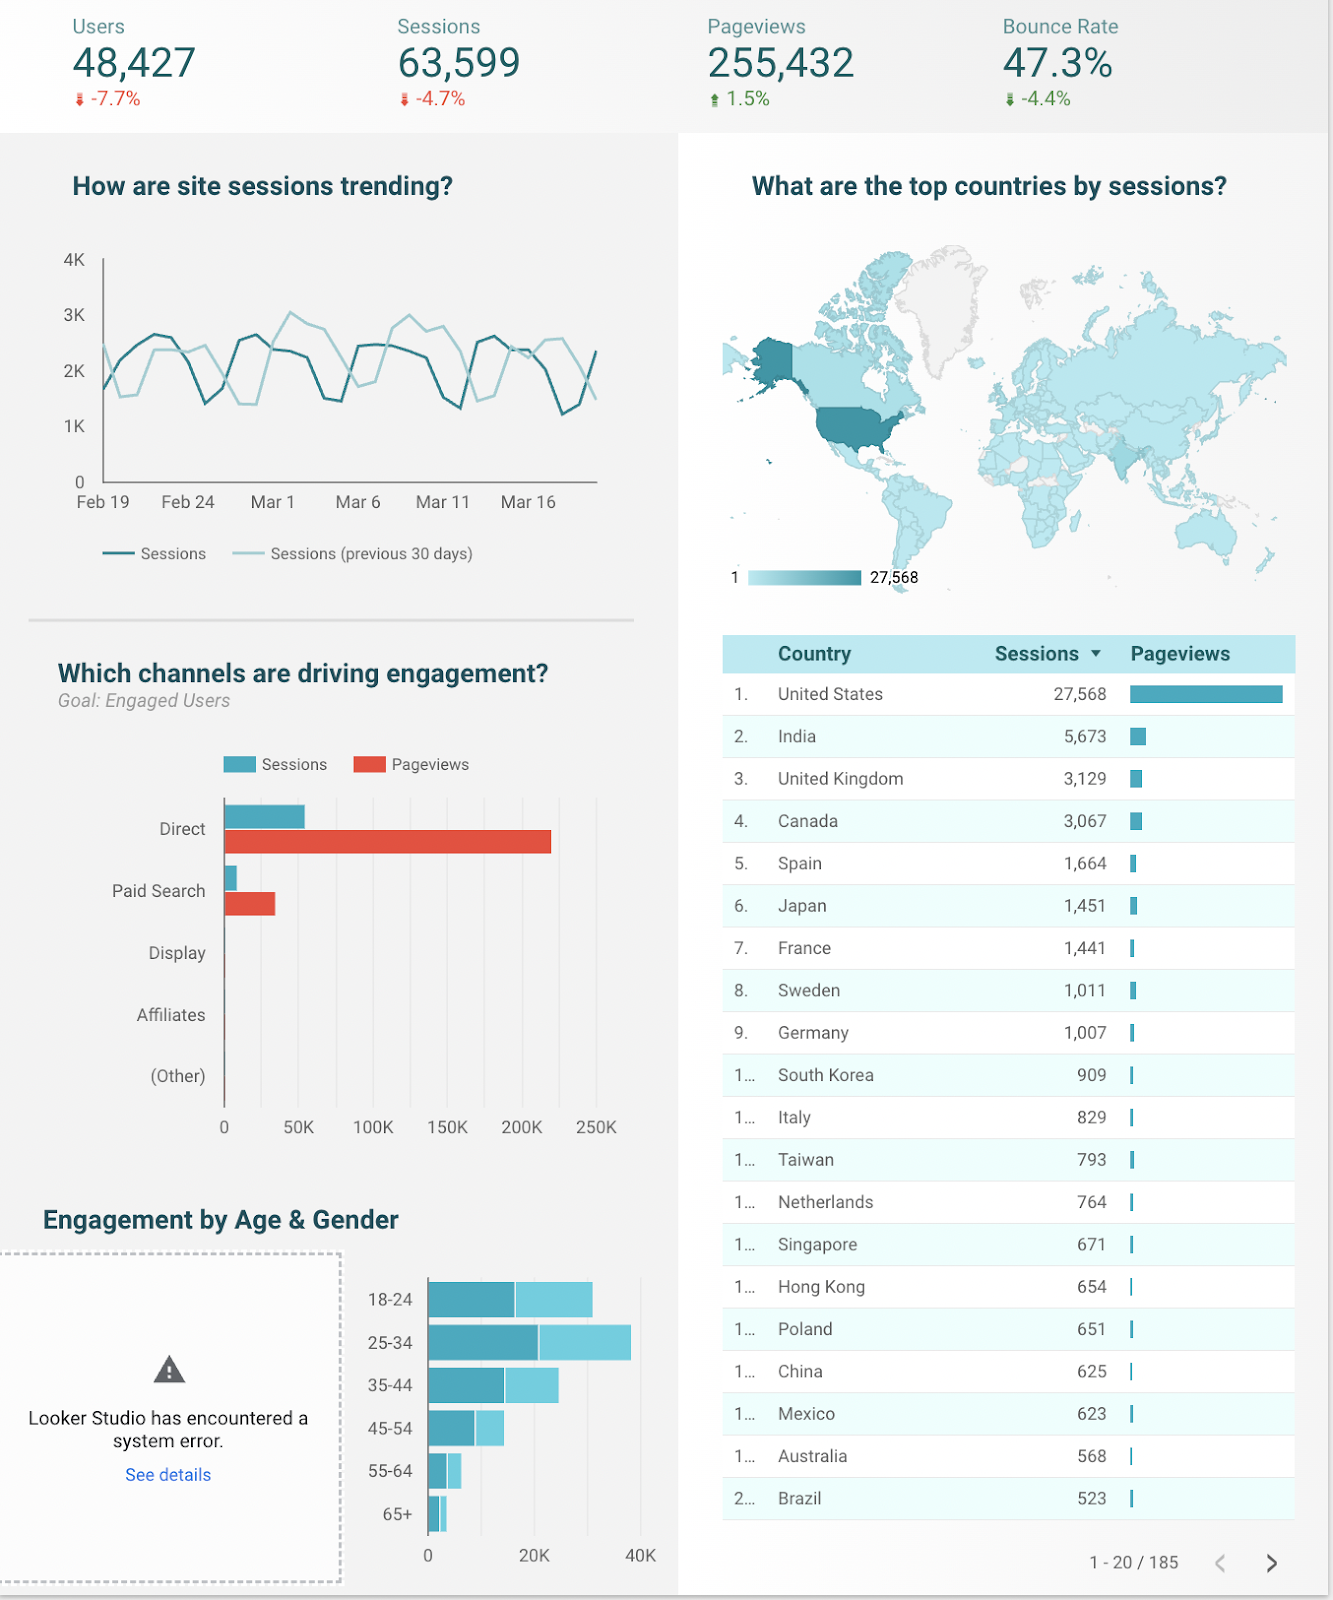
Formerly known as Google Data Studio, Google Looker Studio is a web-based data visualization tool that helps marketers and product managers build customized dashboards and generate detailed reports.
With this tool, you can gather datasets from various sources into one location, visualize them in dashboards and charts, and compare product performances over time. You can also turn all that information into a comprehensive report that you can share with your team, other teams, clients, the C-suite, and stakeholders.
3. HubSpot KPI Software
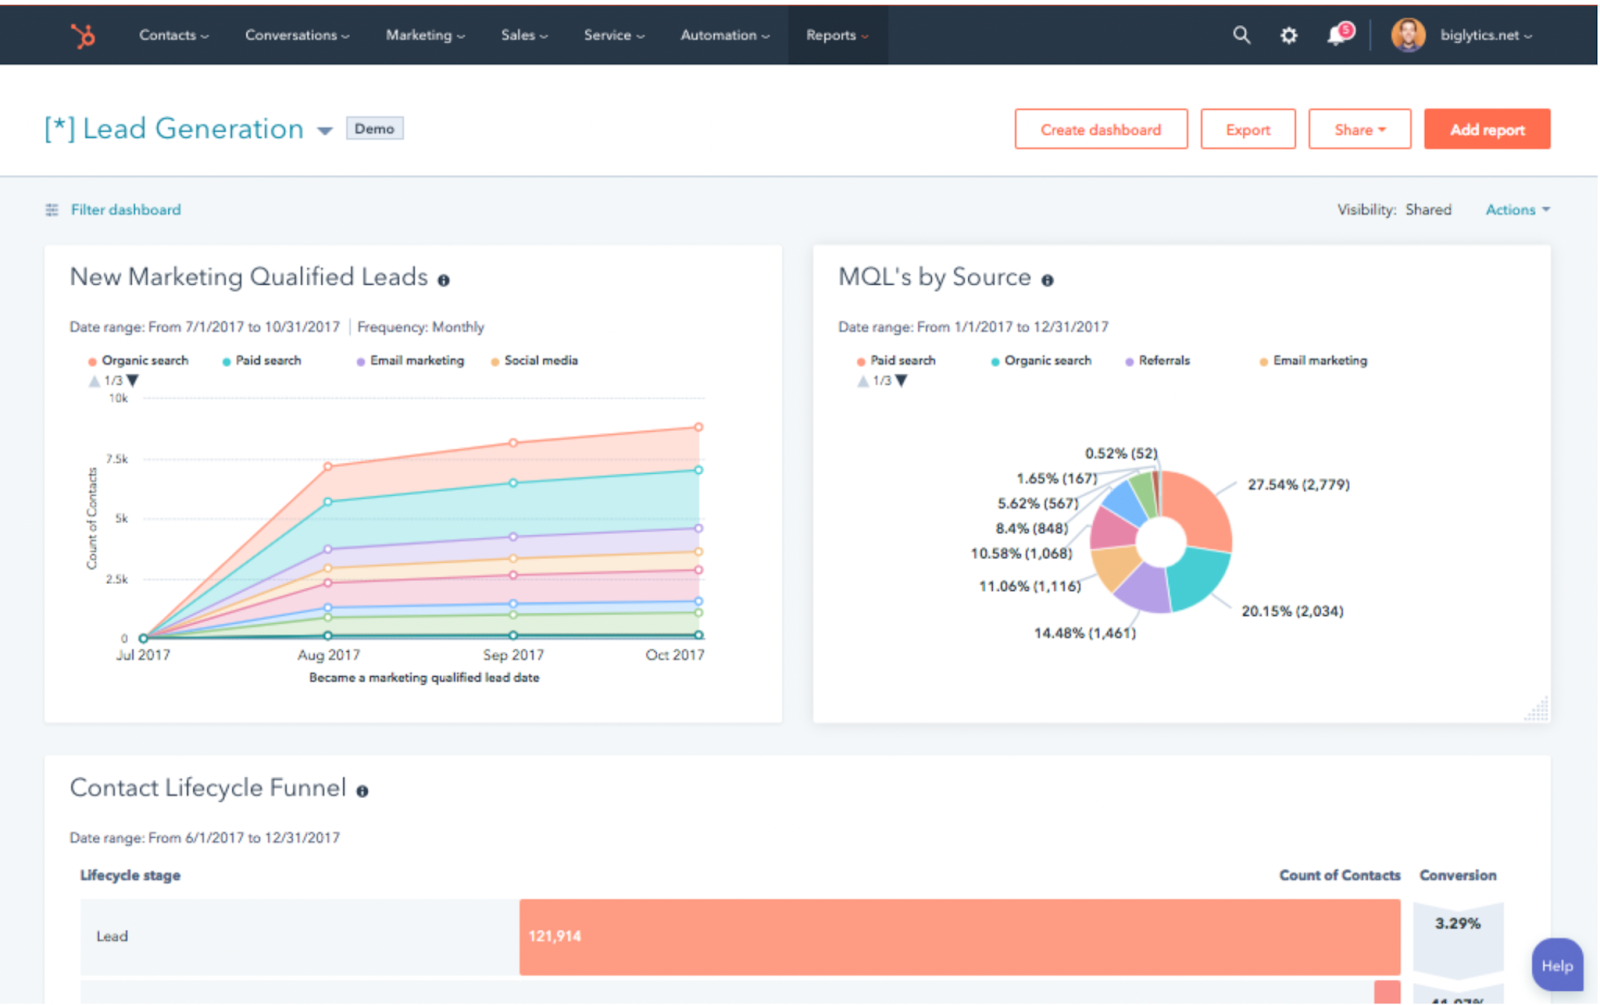
HubSpot KPI software is a tool that helps you track all your product management KPIs in one place, including Customer Acquisition Cost (CAC), Customer Lifetime Value (CLV), and Return on Investment (ROI).
With this tool, you can build custom dashboards that display data drawn from a myriad of sources. You can even pull KPIs from all company departments (including product, finance, marketing, operations, sales, and customer support) to get a bird’s-eye view of how your product is performing across the board.
You can compare data from one department with data from another to get a better idea of how company resources are used and if you’re getting your money’s worth in terms of product performance.
Track Your Product Management KPIs to Make Informed Decisions
If you’re confused about which product management KPIs to track, this list should help you know which ones to start with and/or prioritize. However, the list is not exhaustive.
The key to getting the most from KPIs is to identify the kind of product you’re managing, what success means to you, and the metrics you need to measure to see if you’re doing the right things or not. And when you do measure the KPIs that reflect your product performance well, use them to make informed decisions that help you achieve your goals.
